Last year we built the roster around three big names. When one of them got hurt, the season fell apart. This year there are ten smaller but still Big Ten-caliber names on it, with maybe more to come. I wanted to see what the math actually says about that trade.
What happened last year
Last offseason most of the time and money went into bringing back the Big Three: Jackson Shelstad, Nate Bittle, and Kwame Evans Jr. By the end of the year, by EvanMiya, all three were high caliber. Bittle finished as the 80th-ranked player in college basketball. Evans was 167th. Shelstad, in the 724 possessions he managed before the injury, was 249th. The Big Three were mostly as advertised.
The problem was everyone else. After committing the resources up top, the backfill was a group of players who, it turned out, were not Big Ten caliber: Ege Demir, Devon Pryor, Efe Vatan, Wei Lin. None of the four are transferring up to high-major conferences this spring. The market is telling us we went into last year with only about six high-major players.
Some of that was structural. Once the program committed to bringing the Big Three back, the rest of the offseason was contingent on what they did about the NBA. All three went through the draft process, and that process dragged. The portal moved without us. We didn't know how much money we'd actually have to spend until well into the summer, by which point most of the legitimate high-major portal had been picked over. The thin backfill wasn't entirely a strategic call; it was partly what was left once the NBA answers came back.
And then Bittle got hurt, and then Shelstad got knocked out for the season, and a walk-on ended up in the starting lineup for most of conference play. Bittle and Evans were still high-major players, but there wasn't a third, fourth, or fifth rotation piece behind them with the same level. The team around them came apart.
What we did differently this spring
Shelstad and Evans walked into the portal as real top-end talents. EvanMiya has Evans as a top-ten overall portal player. 247 and On3 had Shelstad somewhere in the 10-15 range before he picked his next stop. Bittle declared for the NBA. There was a version of this offseason where we re-consolidated: spent the same money chasing top-30 names and tried again with the same structure.
Instead, the roster filled out wide. Eight names that one service or another has projected as a Big Ten-level starter (but not an all-conference level player):
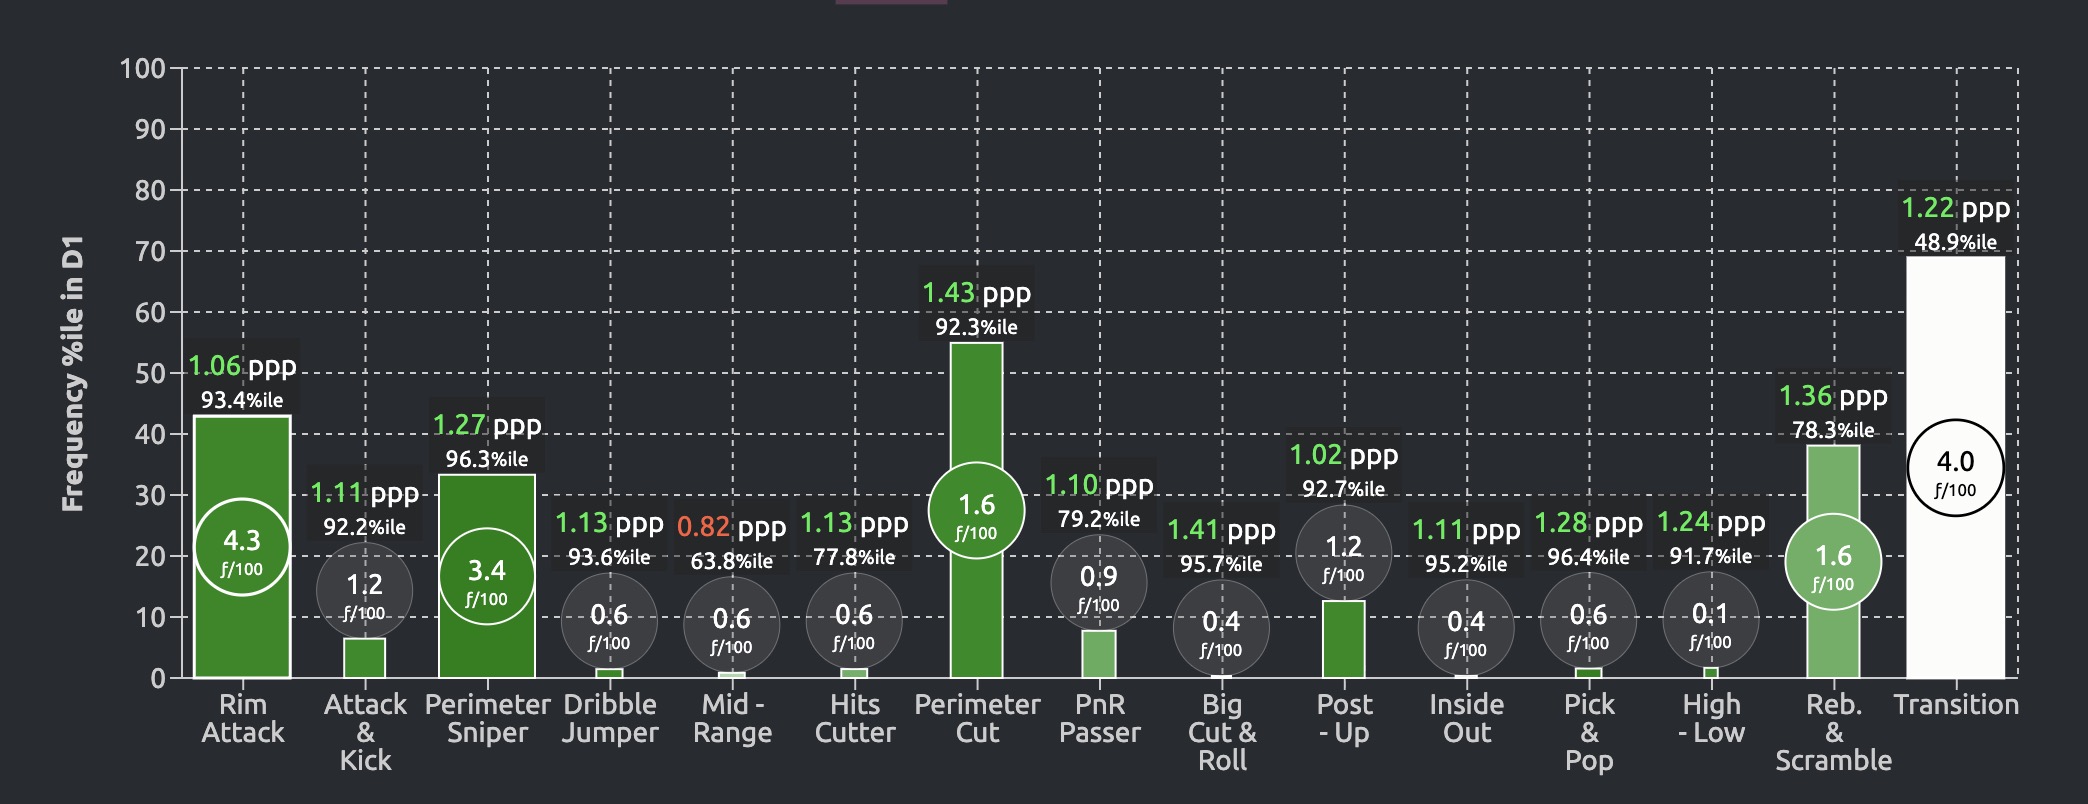
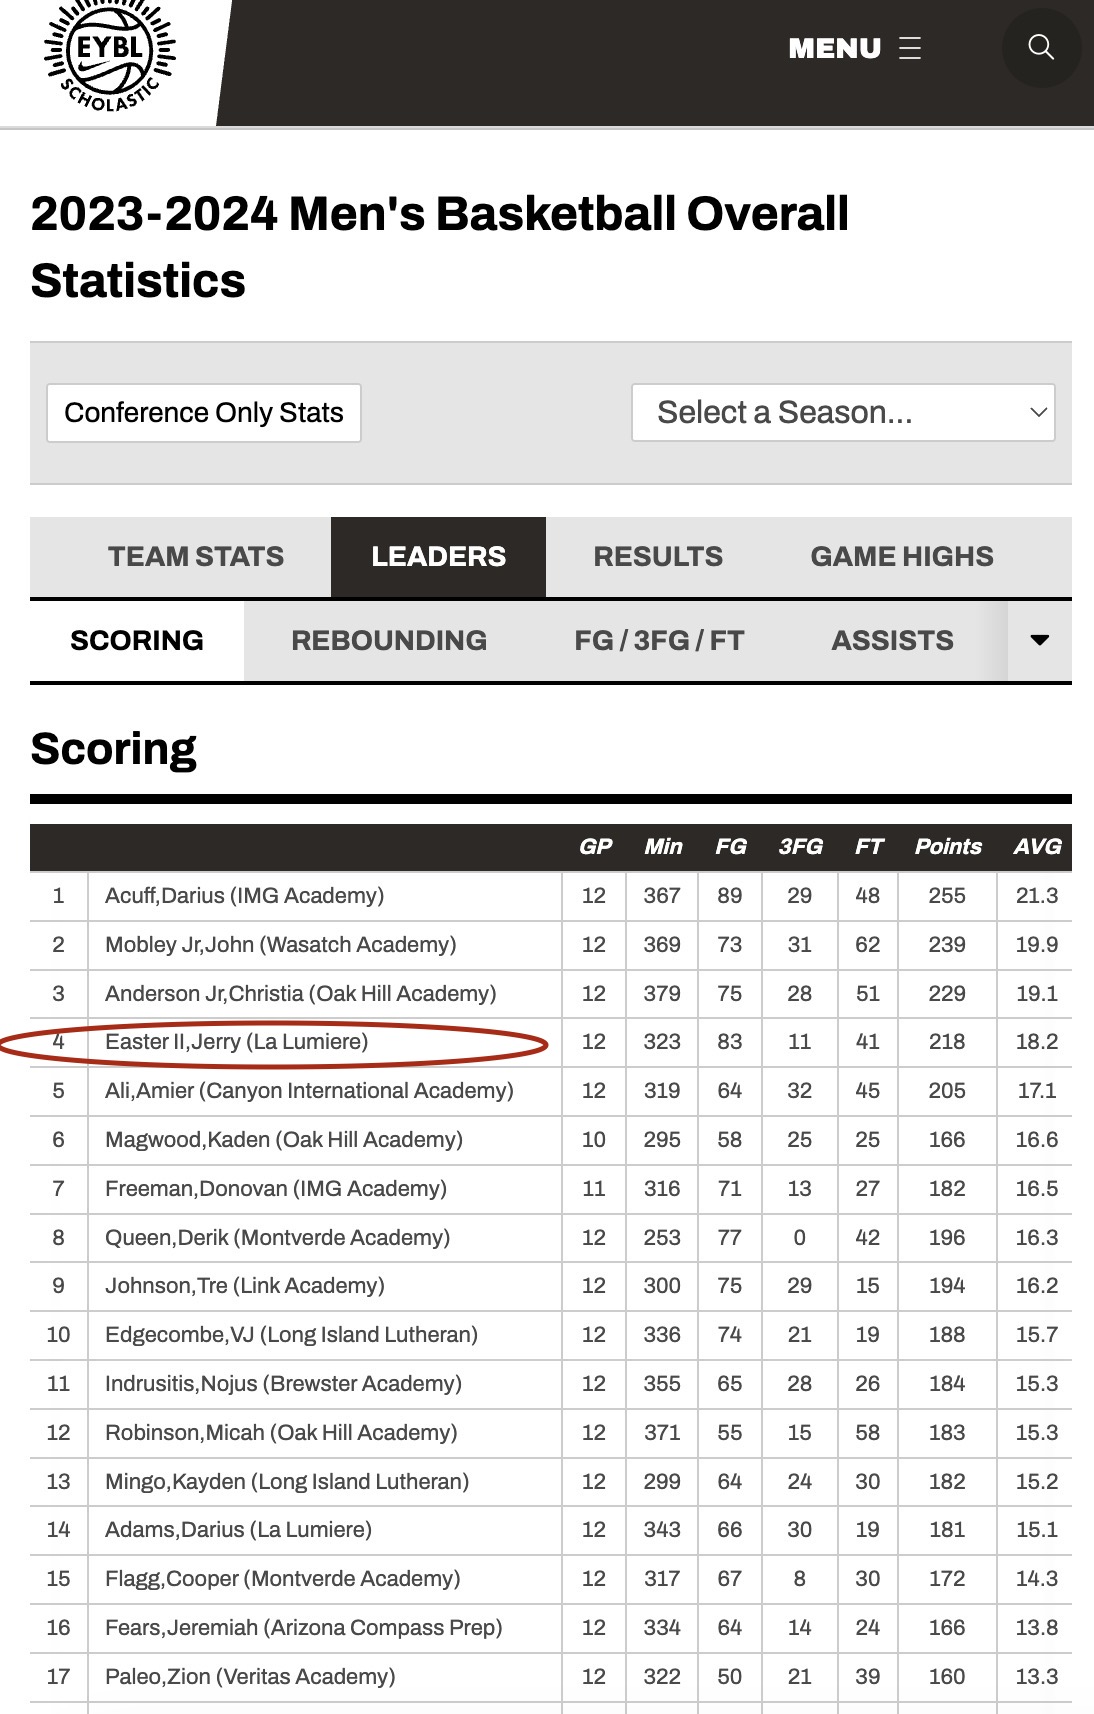
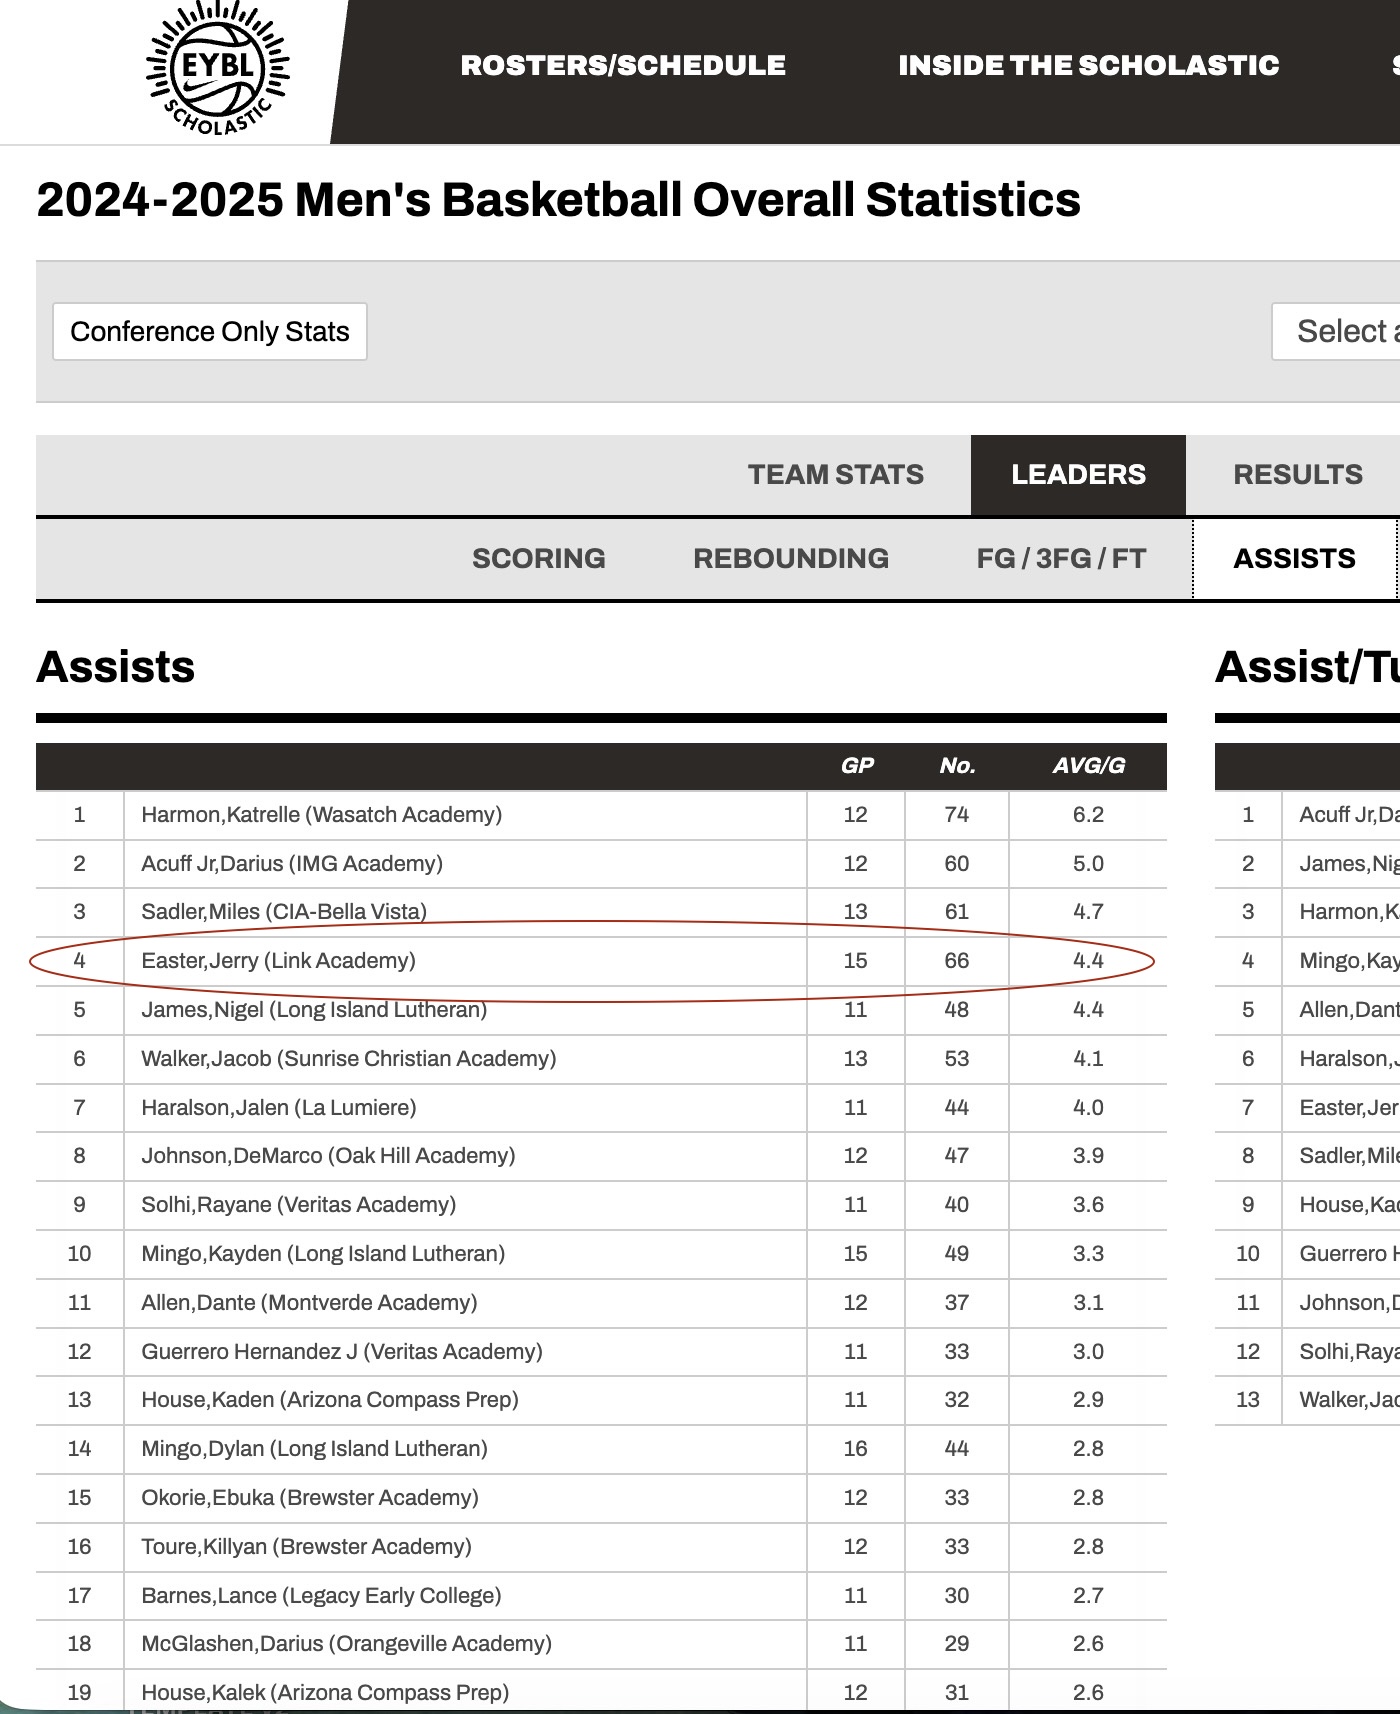
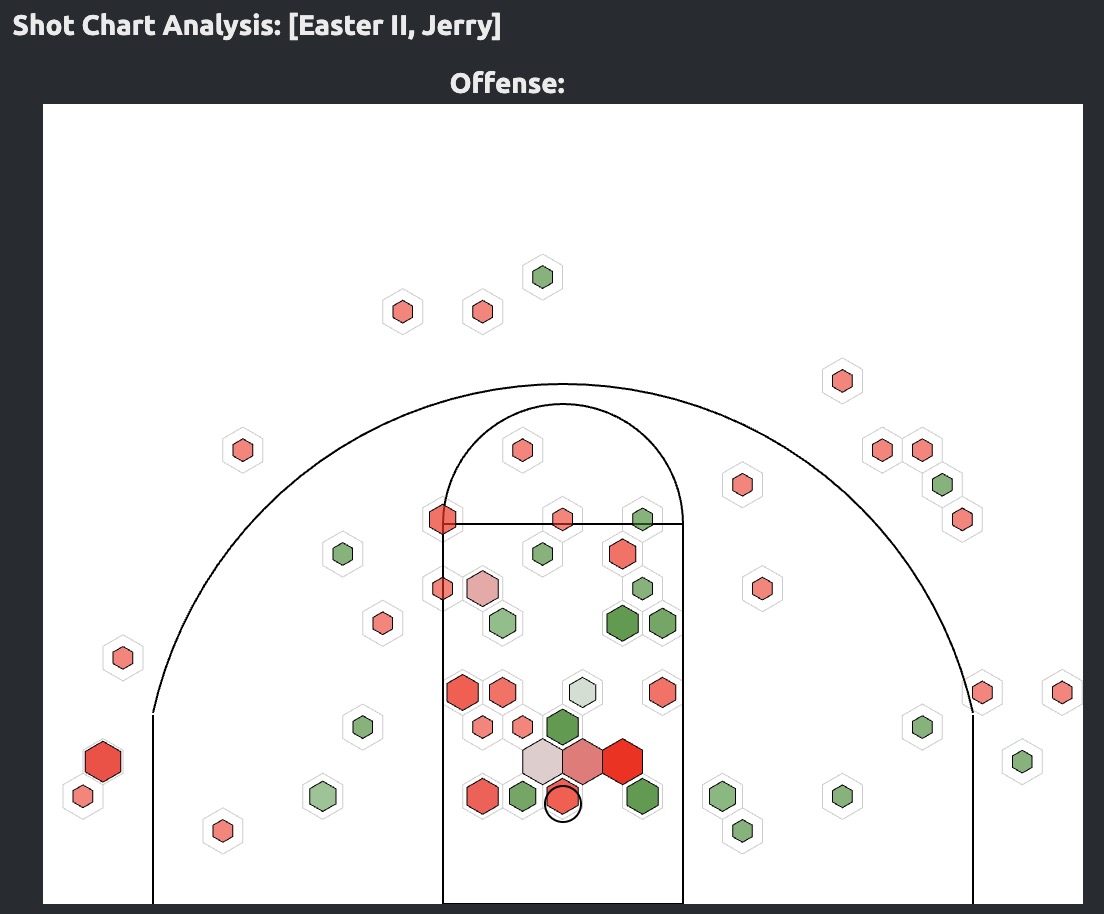
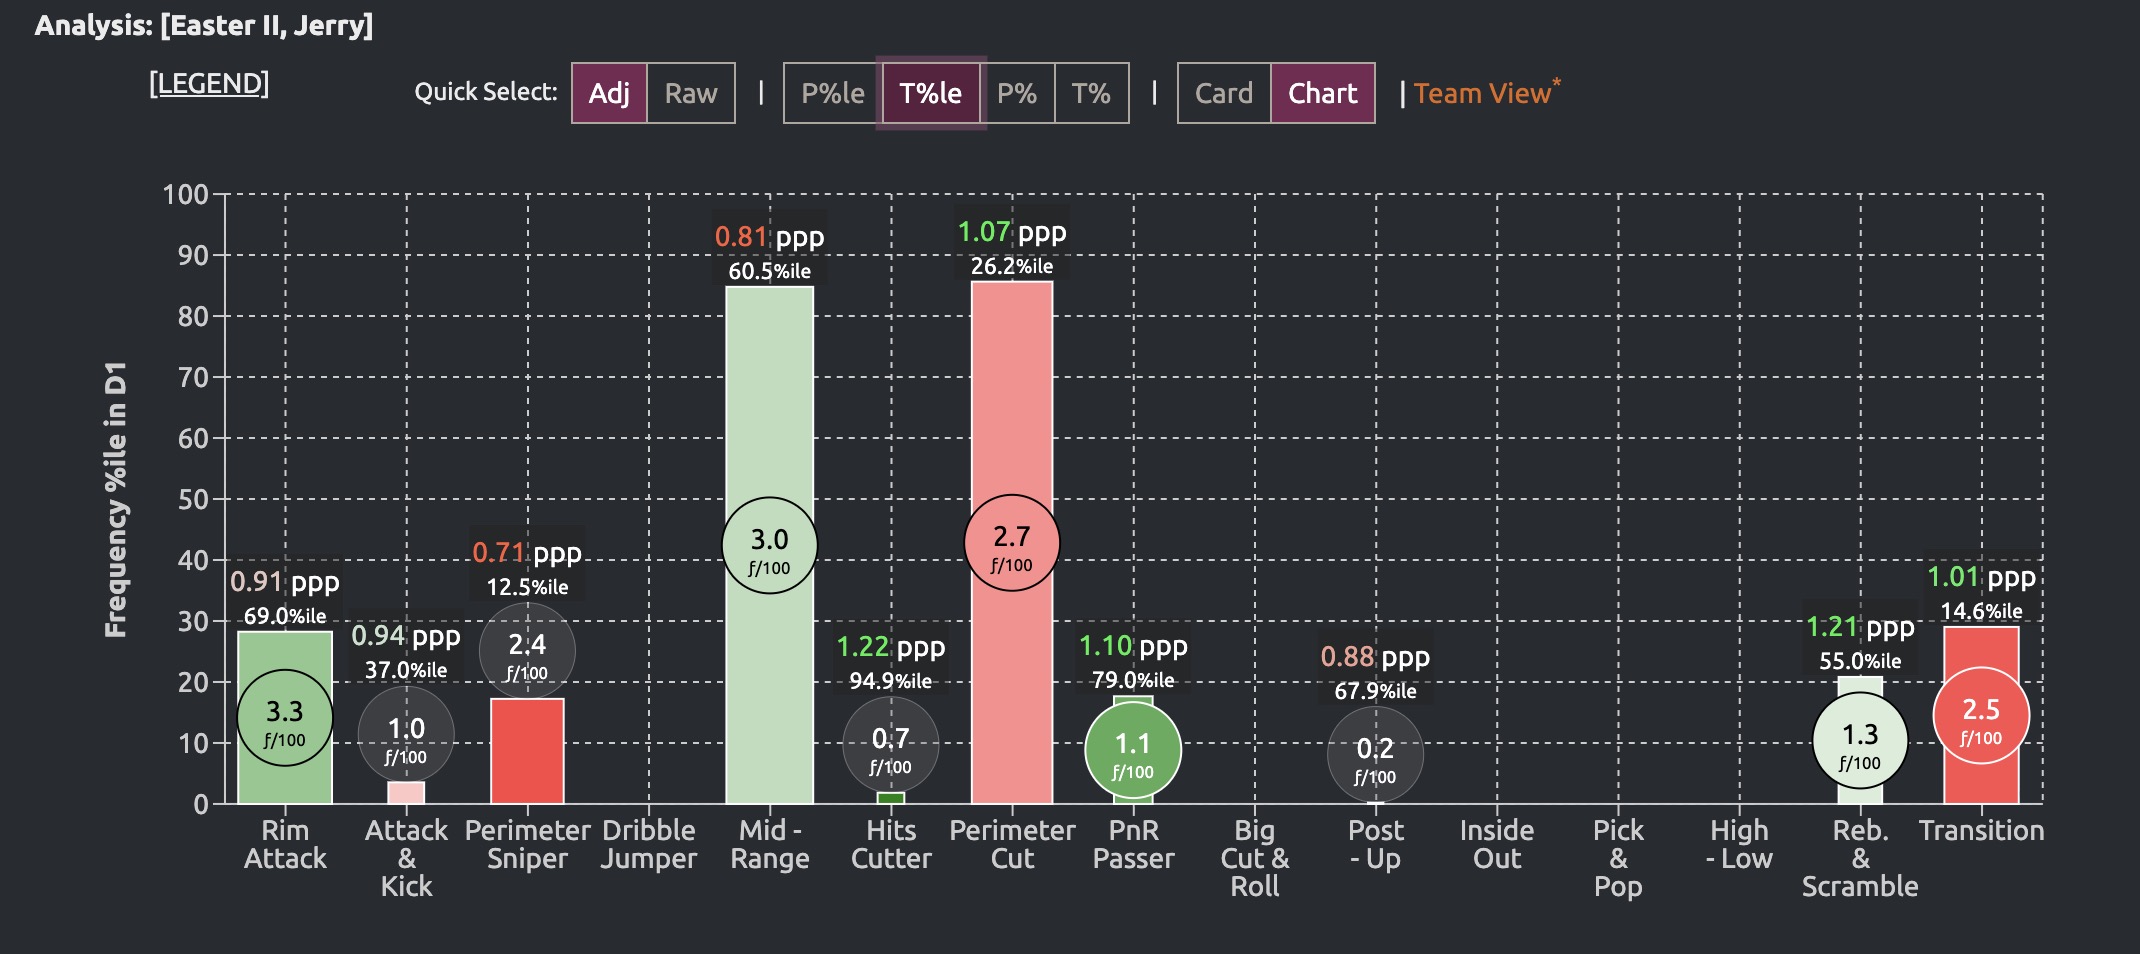
Plus two rotation pieces in Jerry Easter (+1.99) and Tajh Ariza (+2.34). That's ten guys in a real rotation conversation, where last year there were six. We're reportedly still in the market: we were close on Divine Ugochukwu before he picked elsewhere, and reporting has us in the mix for Malik Ewan. Twelve is plausible.
The variance, and what it actually means
College players between 18 and 23 are noisy from one year to the next. Bodies change, roles change, schemes change. I went back and looked at EvanMiya's transfer projections across three full seasons against the actuals (about 1,900 player-seasons in the matched set) to try to put a number on the noise:
- Mean residual = +0.5 BPR. Transfers come in roughly half a point above their projection on average. The market is slightly pessimistic, probably also accounting for injury/washout.
- Standard deviation = ~1.65 BPR. Two-thirds of outcomes land within ±1.65 of the projection. About one-sixth land more than a full standard deviation above it.
- Slight positive skew. Breakouts are a little more common than equally-extreme busts.
- About a 6% complete-bust rate. Roughly one in 17 projections won't materialize at all, whether from a season-ending injury, a role failure, or a mid-year departure. The Monte Carlo applies this as a baseline floor across every player.
What the second bullet means in practical terms: if Jasper Johnson is projected at +3.7, applying the +0.5 bias and the +1.65 standard deviation gives roughly a one-in-six chance he ends up above +5.9. That's not a guarantee, and it's not even particularly likely for any one player. The downside cuts the same way: a one-in-six chance he comes in below +2.6, plus a 6% chance he completely bombs out or gets hurt and misses the whole year, contributing nothing. But if you have several +3-and-up projections on the roster, the math says you should expect at least one of them to land in that breakout range.
The NIL angle
There's also a cost-side version of this. We gave up two players ranked in the top 30 of the portal (Shelstad and Evans), both of whom sit at the steep end of the NIL price curve, where every spot of ranking adds a real chunk of money. In their place we added seven players ranked roughly between the 80th and 230th slots, where prices are flatter.
If the market is even loosely efficient, that's the trade we wanted to make at our talent level. Two top-30 buys vs. seven #80-230 buys is, roughly, the same money for many more bodies. If the curve is steeper than it looks (and most signals suggest it is), we ended up with the better deal.
What 25,000 simulations actually say
A Monte Carlo simulation, named for the Monte Carlo casino because the technique is basically rolling dice over and over, works like this: take the noise model above (each player's projection, the +0.5 bias, the ~1.65 BPR standard deviation) and sample one hypothetical "actual" BPR for every player on the roster. That gives you one plausible season for the team. Sort the ten sampled BPRs, write down the top-5 mean (the starting five) and the top-8 mean (the playing rotation), and you have one data point. Then run the whole thing 25,000 times. What you get isn't a single projection number, it's a distribution of plausible team strengths.
For comparison, I pulled the actual top-5 and top-8 means from each of the last four Oregon rosters.
One caveat before the table: this compares a simulated distribution of next year's outcomes to single realized seasons from the past. We don't know what those past rosters' Monte Carlos would have shown going into their seasons. So read these less as a clean head-to-head and more as "does the simulated band overlap or sit above the band of past outcomes."
The median outcomes for the 2027 10-player roster:
- Top-5 starting lineup median: +5.02 BPR. Above three of the last four Oregon seasons, below the 24-25 high-water mark of +5.45.
- Top-8 rotation median: +4.18 BPR. Just under 24-25's +4.23, close to a match for the best Oregon rotation of the last four years.
- P(any player above +6.0 BPR) = 67%. More likely than not that someone on the 2027 roster has a real star season.
- P(at least two players above +5.0 BPR) = 73%. Strong odds of multiple All-Big-Ten caliber pieces.
- P(at least three players above +4.0 BPR) = 88%. Likely we have a real core of high-level rotation guys.
Odds vs. the last four Altman rosters
The question I really wanted to answer is whether the 2027 roster, built so differently, lands in the same neighborhood as the actual Oregon rosters of the last four years. I wanted to know how likely it was that our new starting lineup would be better than the last couple years, and how likely it was that our new 8-man rotation would be better than it has been the last few years.
| Season |
Their top-5 |
Odds of a better 2027 top-5 |
Their top-8 |
Odds of a better 2027 top-8 |
22-23 missed NCAAs
Dante / Richardson / Bittle / Ware / Guerrier |
+4.26 |
88% |
+3.57 |
83% |
23-24 11-seed
Dante / Couisnard / Evans / Barthelemy / Shelstad |
+4.70 |
69% |
+3.47 |
86% |
24-25 high-water · 5-seed
Bittle / Evans / Shelstad / Barthelemy / Bamba |
+5.45 |
25% |
+4.23 |
47% |
25-26 missed NCAAs
Bittle / Evans / Shelstad (the year the depth failed) |
+4.65 |
72% |
+3.08 |
94% |
A note on the 25-26 row: Shelstad's +4.88 BPR is his per-possession rate over the 724 possessions he played before the injury. EvanMiya's metric is per-possession, so the rate stands as if he'd played the whole season. The 25-26 top-5 of +4.65 in the table is, in effect, a fully-healthy Big Three; the actual played-out season was worse. All of the odds against 25-26 in this article are against the version of last year where the Big Three stay healthy, not the version that actually happened. We're currently running at a 72% chance that we're already in better shape with the starting lineup than we were at the beginning of last season when the whole roster was healthy.
On the top-8 rotation metric, the simulation has the new roster around a coin flip against the program's best-of-the-last-four-years mark, a clear favorite vs. 22-23 and 23-24, and very likely to clear last year's broken rotation. On the top-5 lineup metric, it's a favorite over three of the four prior teams. The exception is 24-25, where Bittle, Evans, Shelstad, Barthelemy, and Bamba all turned in 4+ BPR seasons in the same year: a hard outcome to replicate at the front of the roster.
The 25-26 row is the one worth sitting with. Last year's top-5 still cleared +4.65, because Bittle, Evans, and Shelstad were real players. That team was never that good. We were never at full health, and we played most of the season severely diminished. But this exercise is about roster construction. We don't penalize for last year's injuries, and we model this year's risk by saying that each player has a 6% chance of not making it. Getting as close to apples-to-apples as we can with this data. We're comparing where we stand this summer to where we stood last summer.
What each commitment actually bought us
Another way I wanted to look at this is in the order the commitments actually came in: what each new signing, as the spring rolled out, did to the simulated odds of beating last year's top-5 of +4.65. (Setting aside our incoming HS freshman Seven Spurlock, who's on the roster but doesn't project as a top-ten rotation piece yet.)
| # |
Last commit |
Top-5 |
Odds vs. 25-26 |
| 5 | Andrew Meadow | +3.40 | 10% |
| 6 | Jasper Johnson | +4.19 | 27% |
| 7 | Jerry Easter | +4.32 | 32% |
| 8 | Taylor Bol Bowen | +4.56 | 44% |
| 9 | Fred Payne | +4.73 | 55% |
| 10 | Dwayne Aristode | +5.02 | 72% |
| 11 | hypothetical +3.0 add | +5.13 | 77% |
| 12 | hypothetical +3.0 add | +5.22 | 82% |
The order the commits came in: Ariza first, Stewart deciding to return, Riley, Compton, then Meadow rounding out the first five. At that point the simulation has us at 10% against last year's top-5. Five commits in, the math said we still had work to do.
Jasper Johnson commits over from Kentucky and the odds jump to 27%. Easter to 32%. Bol Bowen to 44%. Payne is the one that pushes it past 50/50, to 55%. Aristode coming in late as the highest-projected single signing of the spring is the largest single move: 55% to 72%.
The reporting says we're not done. If we land one more rotation-caliber transfer in the Malik Ewan tier (call it a +3.0 BPR projection), the simulation moves to 77%. A second one of those would put us at 82%. That gets us close to where adding more transfers stops materially changing the odds.
Most of the lift up to ten is real new value, not just depth bookkeeping. It makes for good copy and good narratives to project a starting lineup and pretend we know how these players' futures are going to go. We don't. What landing this "depth" of B1G-starter quality really gets us is more chances for good players to break out, launch up to the next level, and carry a team in '27.
Where this lands
The thing that really jumped out running this: the expected average of our top-5 (+5.02) is higher than the projection of any single player on the roster. Compton is +4.34. Aristode is +4.30. The simulated top-5 mean of the whole roster lands above both of them. That's the bites-at-the-apple effect in numbers. We sample ten noisy projections, take the best five, and the average of those five lifts above any individual's ceiling. I knew the effect would be real. I didn't expect it to be that big.
The same idea hits harder when you set Shelstad's 25-26 as the bar. Every name on this roster is projected as worse than Shelstad was last year. Compton's +4.34 is the highest, Shelstad finished at +4.88. By the static projections alone, every individual on this team is worse than the player that we let walk out the door. That's not how it ends up. With ten projections and 1.65 BPR of year-over-year noise per player, the math says the expected number of guys who reach or beat Shelstad's mark is 2.54. The probability of at least one is 95%. Three or more is roughly a coin flip. We just don't know which guys they'll be yet.
And we were already a coin-flip favorite to beat last year's healthy-Big-Three starting five before Aristode signed. After nine commits (no Aristode), the simulation had us at 55% against 25-26's +4.65. Aristode pushed it to 72%. The depth had done most of the work first.
What the simulation says, roughly: the 2027 roster is favored against three of the last four Oregon teams and around a coin flip against the best of them. None of that is a guarantee. The 5th percentile of the simulation is a real outcome too, and at that level we'd be a worse team than 25-26 on the rotation metric. But the median sits well above last year on both top-5 and top-8, and that's the part that wasn't there before.
Methodology: per-player Monte Carlo, 25,000 sims. Calibrated against 1,872 EvanMiya transfer projections from 23-24 to 25-26. +0.5 BPR bias on the projection mean, σ ~1.4-1.8 by projection bucket, with a 6% injury-rate floor applied to every player. Returners get half the bias and a tighter σ; freshmen get a wider σ to reflect the absence of college tape. Player outcomes are sampled independently, so the simulated variance is probably a bit tight (real BPR has shared team-context).